The foil page
Every section in the library has a page: its shape, its geometry figures, a stored sweep of polars, a live run at any Reynolds number, and downloads for CAD and other tools. This page explains each control, top to bottom.
Geometry figures
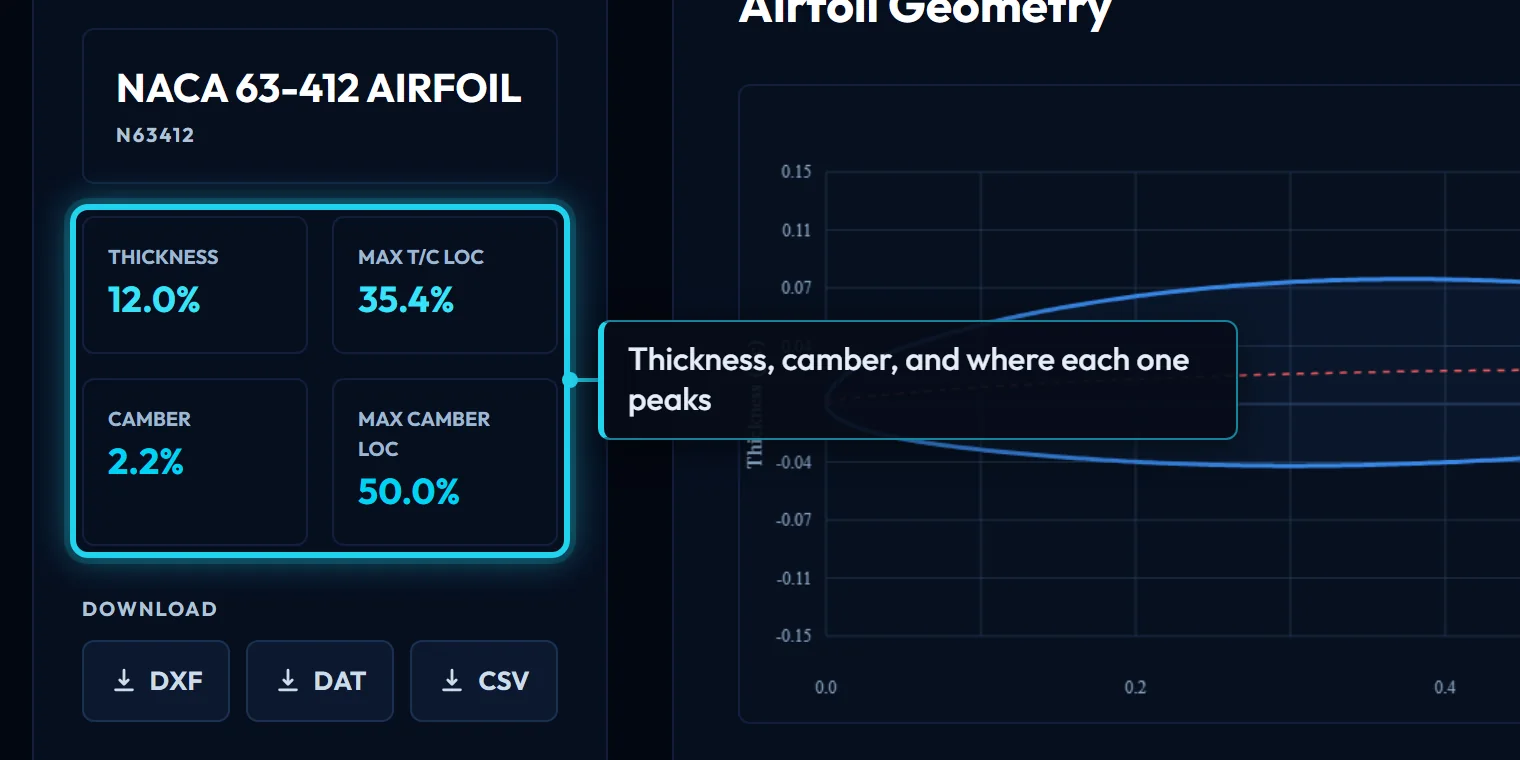
Four numbers describe the shape before any aerodynamics:
- Thickness is the maximum thickness as a percentage of chord. Thicker sections stall more gently and hold more structure; thinner ones have less drag at low lift.
- Max t/c loc is where that maximum sits, as a percentage of chord from the leading edge. Further aft usually means a longer laminar run and a narrower low-drag range.
- Camber is how far the mean line bows away from the chord line, as a percentage of chord. More camber shifts the lift curve up and moves the drag bucket toward higher lift.
- Max camber loc is where the camber peaks.
They are measured from the drawn CST geometry, the same curve the DXF and DAT downloads carry.
Kulfan parameters
The section is stored as CST (Kulfan) parameters, not as points: two class exponents (n1, n2), a trailing-edge thickness, a leading-edge weight, and a row of Bernstein weights for each surface. The read-only box shows them. Paste them into the Kulfan canvas to change the shape, or use them with the API.
Load performance data
Every section in the library was run through NeuralFoil once and the result stored: 14 Reynolds numbers from 20,000 to 10,000,000, each at Ncrit 1, 4, 9, angle of attack -20° to 25° in 0.5° steps. "Load Performance Data" fetches that sweep; nothing is computed. See NeuralFoil for how it was run and Validation for how it compares with measurement.
Transcript
- Every section was run through NeuralFoil once and the result stored: 14 Reynolds numbers at three Ncrit levels.
- Load Performance Data fetches that sweep; nothing is computed now. The chart opens with three Reynolds numbers ticked.
Simulation conditions
The settings the stored sweep was run at: Mach 0 (incompressible), the Ncrit shown, and NeuralFoil's large network. They are fixed for stored data; a live run uses the same Mach and model, and the Ncrit the chart is set to.
The chart
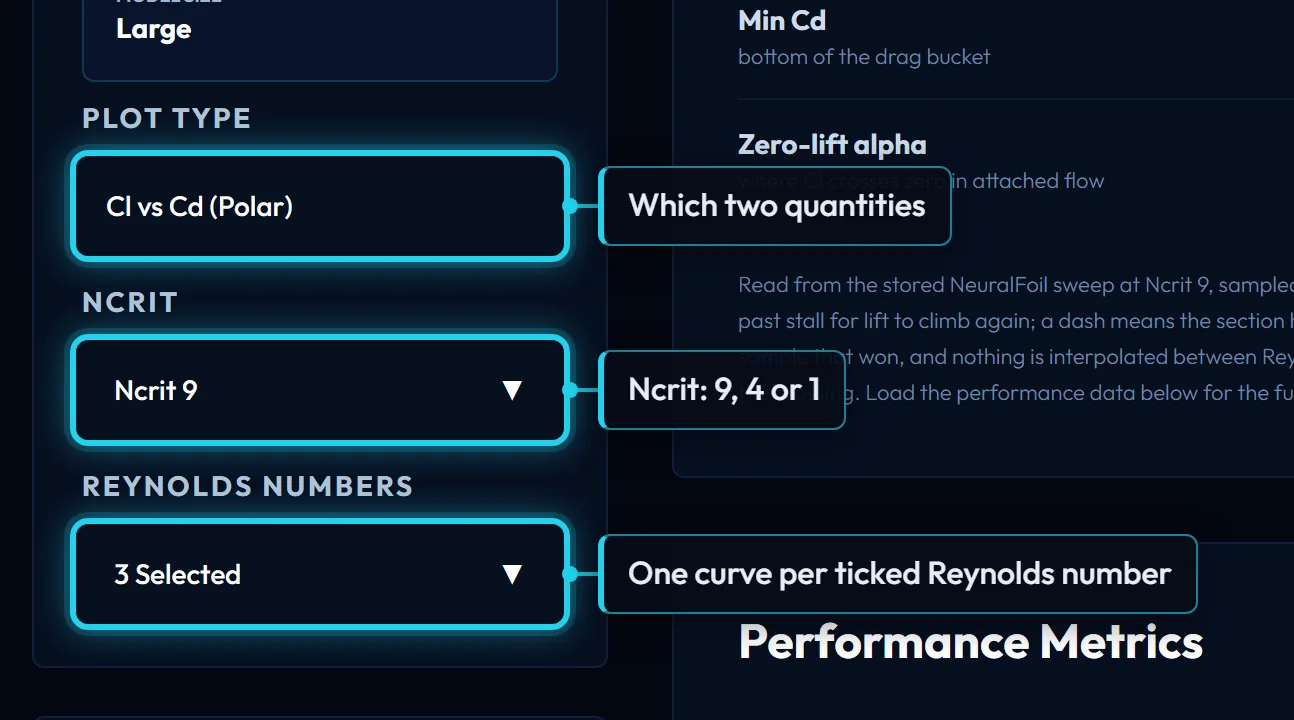
Plot type chooses which pair of quantities is drawn:
- Cl vs Cd (the polar): lift against drag. The lowest point of the curve is the minimum drag; the point furthest from the origin along a line through the origin is the best lift-to-drag ratio.
- Cl vs alpha: the lift curve. Its slope is about 0.1 per degree for any section; its height is set by camber; the peak is the stall.
- Cd vs alpha: the drag bucket, and how fast drag rises outside it.
- Cm vs alpha: the pitching moment about the quarter chord. Negative is nose-down. A cambered section has a negative Cm that barely changes with angle until the stall.
One curve per ticked Reynolds number, at the selected Ncrit. Zoom with a click-and-drag, double-click to reset, hover for values.
Ncrit
How readily the boundary layer turns turbulent. 9 is the clean-tunnel standard and the default; 4 and 1 stand for a rougher surface or more turbulent flow. The stored sweep carries all three, and a live run uses whichever the chart is set to. Ncrit explains how to choose.
Reynolds numbers
Which of the stored Reynolds numbers are drawn. Each ticked value is one curve; the list opens with three ticked, near 100k, 500k and 1M. Tick the ones around your own operating point. For the exact value, run it below. Reynolds number explains how to work yours out.
Transcript
- Each ticked Reynolds number is one curve. Tick the ones around your own: the freeride foil cruises near 590k.
- 5e5, 7.5e5 and 1e6 now bracket the cruise point; for the exact value, run it below.
Run it at your Reynolds number
The stored sweep is at fixed Reynolds numbers. Type the one your chord and speed actually give (340000, 340k or 3.4e5, between 10,000 and 100,000,000) and press Run NeuralFoil: the polar is computed now, at the Ncrit the chart is set to, and drawn with the stored curves as a dashed "your run" line. A value that is already stored at that Ncrit is shown without a run.
Transcript
- Not in the stored list? Type the Reynolds number your chord and speed give: 590000, 590k or 5.9e5.
- NeuralFoil computes that polar now, at the Ncrit the chart is set to, and draws it dashed with the stored curves.
Free runs
3 live runs per 30 days without an account. With a free account the live run is unlimited, up to 120 an hour. The counter beside the box says which you are on.

Downloads
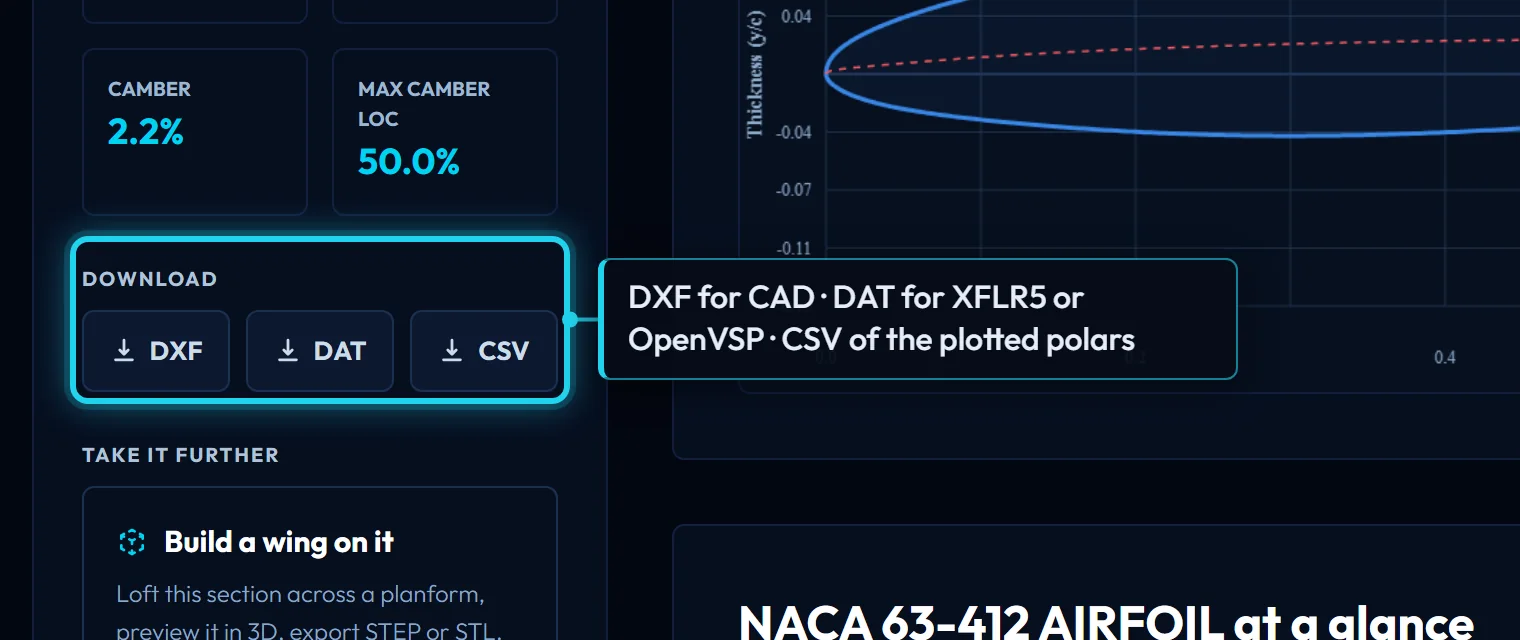
- DXF: the section at a 1000 mm chord, one cubic spline per surface, for CAD. Scale it in your CAD program, or use the Kulfan canvas, which takes a chord in mm.
- DAT: Selig-format coordinates, 151 points at unit chord, the section name on the first line, from the trailing edge over the top to the leading edge and back along the bottom. XFLR5, XFoil, OpenVSP and most other tools read it.
- CSV: the polars as drawn: the ticked Reynolds numbers at the selected Ncrit, one row per angle of attack, columns
Re,Ncrit,alpha,CL,CD,CM. The button is disabled until something is plotted.
Transcript
- DXF: the section at a 1000 mm chord, one cubic spline per surface, for CAD. Scale it there, or use the Kulfan canvas for a chord in mm.
- DAT: Selig coordinates at unit chord, the file XFLR5, XFoil and OpenVSP read.
- CSV: the polars as plotted, one row per angle of attack, the ticked Reynolds numbers at the selected Ncrit.
File formats has the details of each.
At a glance
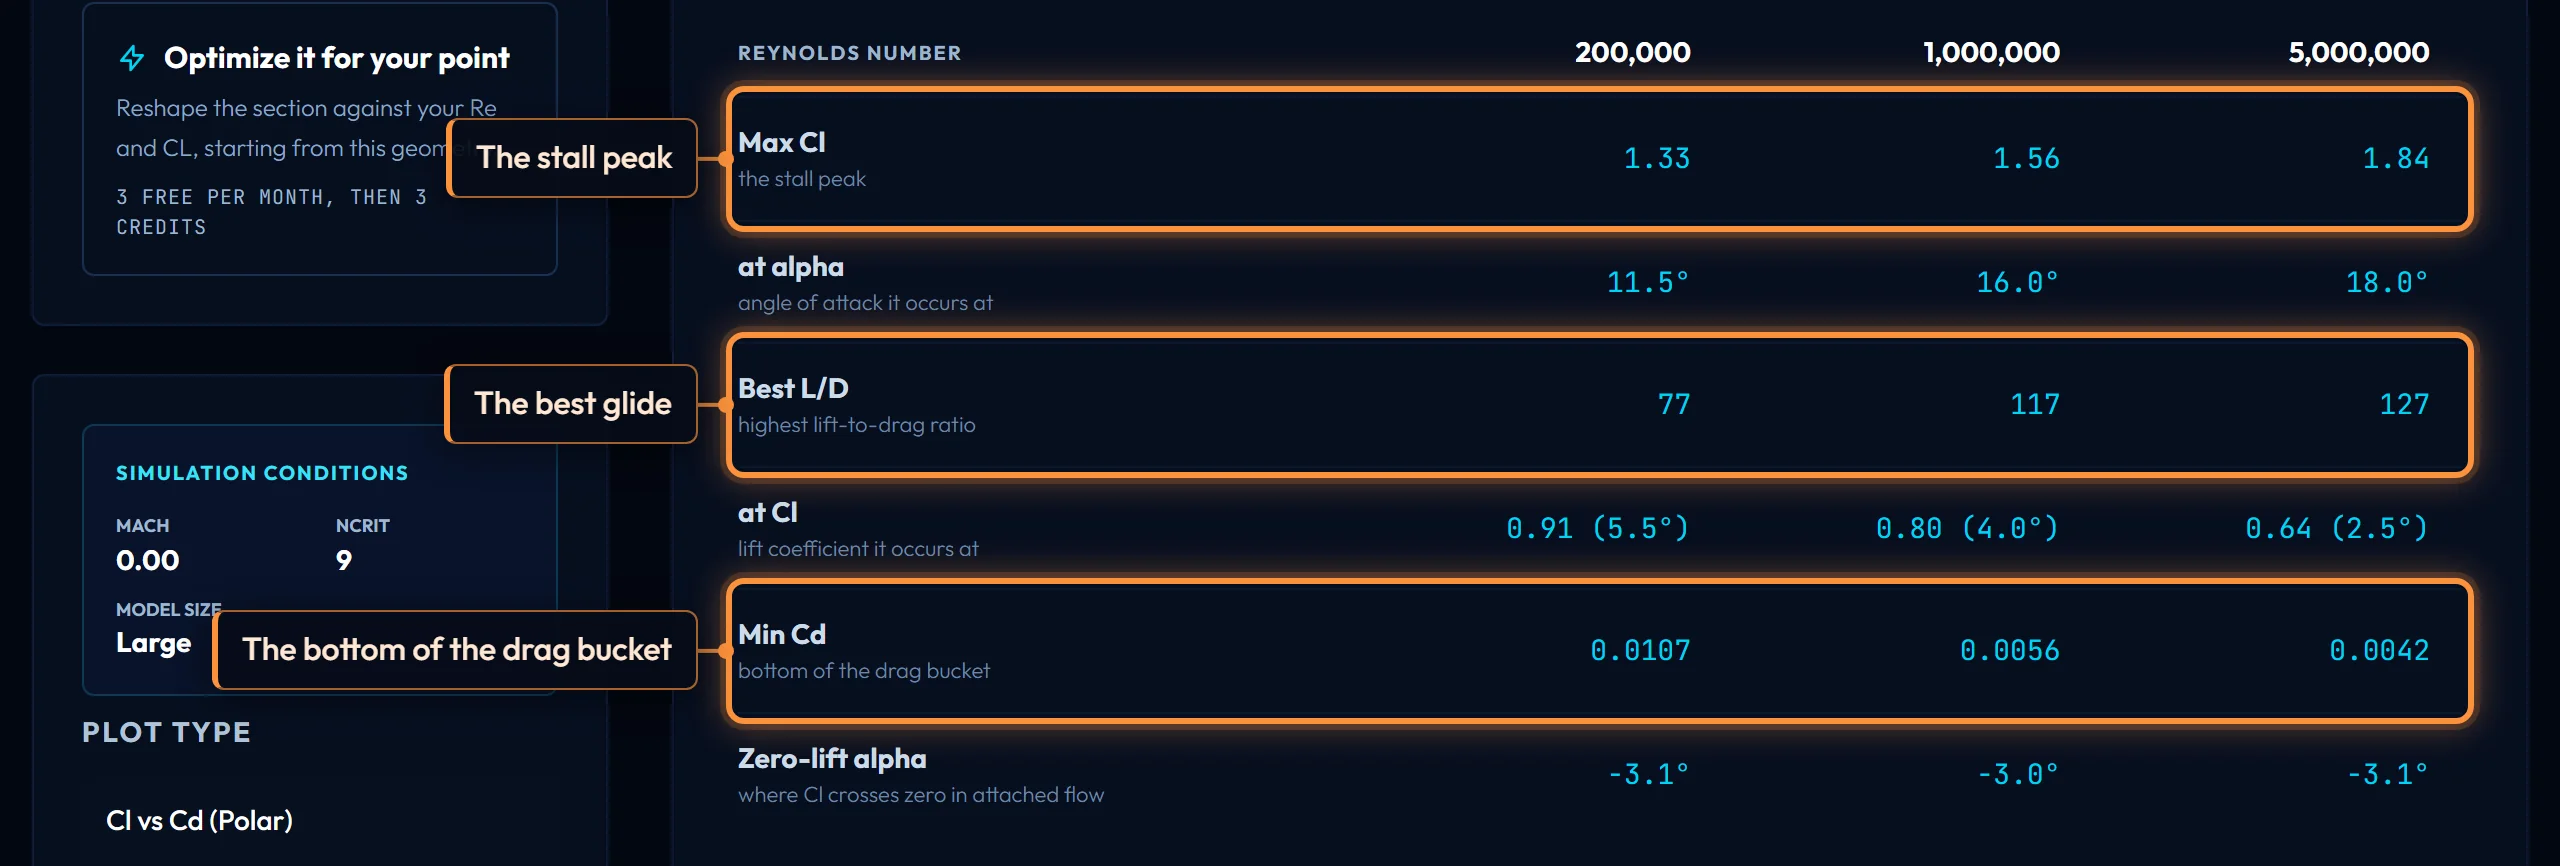
The table above the chart reads six figures from the stored sweep at Ncrit 9, at each of three Reynolds numbers:
- Max Cl is the stall peak: the first maximum of the lift curve, not the largest value in the sweep, which runs far enough past stall for lift to climb again. At alpha is the angle it occurs at.
- Best L/D is the highest lift-to-drag ratio, and at Cl the lift coefficient and angle it occurs at. Flying near that Cl gives the best glide.
- Min Cd is the bottom of the drag bucket.
- Zero-lift alpha is where the lift curve crosses zero with the flow attached; negative for a cambered section.
A dash means the section had not stalled by the end of the sweep, or, for the zero-lift angle, that it stalls negatively before lift reaches zero.
Controls on this page
| Control | What it does | Units |
|---|---|---|
| Ncrit | How readily the boundary layer turns turbulent, as the e^N transition exponent. 9 is the clean-tunnel standard and the default here; 4 and 1 stand for a rougher surface or more turbulent flow, and mainly move the drag bucket. | |
| Thickness | Maximum thickness as a percentage of chord, measured from the drawn geometry. Thicker sections stall more gently and hold more structure; thinner ones have less drag at low lift. | % chord |
| Max t/c loc | Where along the chord the section is thickest, as a percentage from the leading edge. Further aft usually means a longer laminar run and a narrower low-drag range. | % chord |
| Camber | Maximum camber as a percentage of chord: how far the mean line bows away from the chord line. More camber shifts the lift curve up and moves the drag bucket toward higher lift. | % chord |
| Max camber loc | Where along the chord the camber peaks, as a percentage from the leading edge. | % chord |
| Kulfan parameters | The CST (Kulfan) numbers that draw this section: class exponents n1 and n2, a trailing-edge thickness, a leading-edge weight, and the Bernstein weights of each surface. Paste them into the Kulfan canvas to edit the shape. | |
| Load performance data | Fetches the stored NeuralFoil sweep for this section: 14 Reynolds numbers at Ncrit 1, 4, 9, α -20° to 25° in 0.5° steps. It was run once and stored; nothing is computed now. | |
| Simulation conditions | The settings the stored sweep was run at: Mach 0 (incompressible), the Ncrit shown, and NeuralFoil's large network. Fixed for stored data; a live run uses the same Mach and model. | |
| Plot type | Which pair the chart draws: lift against drag (the polar), or lift, drag or pitching moment against angle of attack. One curve per ticked Reynolds number, at the selected Ncrit. | |
| Reynolds numbers | Which of the stored Reynolds numbers are drawn; each tick is one curve. Tick the ones around your own operating point. For the exact value, run it below the chart. | |
| Run it at your Reynolds number | Type the Reynolds number your chord and speed give (340000, 340k or 3.4e5; 10,000 to 100,000,000). NeuralFoil computes that polar now at the chart's Ncrit and draws it with the stored curves. A stored value costs no run. | |
| Free runs | 3 live runs per 30 days without an account. With a free account the live run is unlimited, up to 120 an hour. | |
| Download | DXF: the section at a 1,000 mm chord, for CAD. DAT: 151 Selig-order points at unit chord, for XFLR5, XFoil or OpenVSP. CSV: the plotted polars, columns Re, Ncrit, alpha, CL, CD, CM. | |
| Max Cl | The lift coefficient at the stall peak: the first maximum of the lift curve, not the largest value in the sweep, which runs far enough past stall for lift to climb again. | |
| Best L/D | The highest lift-to-drag ratio in the sweep, and the lift coefficient and angle it occurs at. Flying near that Cl gives the best glide. | |
| Min Cd | The lowest drag coefficient in the sweep: the bottom of the drag bucket, where cruise and speed runs live. | |
| Zero-lift alpha | The angle of attack where lift crosses zero with the flow attached. Negative for a cambered section; the lift curve rises from here at about 0.1 per degree. | |
| Reynolds number | Re = V·c/ν: speed times chord over the fluid's kinematic viscosity. The one number that says how big and fast a wing is to the fluid; every polar depends on it. | |
| Polar | A section's lift, drag and pitching-moment coefficients across angle of attack at one Reynolds number and Ncrit. The Cl-vs-Cd curve is the polar proper. | |
| Cl | Lift coefficient: lift divided by dynamic pressure and area. Depends on angle of attack, camber and Reynolds number, not on size. | |
| Cd | Drag coefficient of the section alone (profile drag). A finite wing adds induced drag on top of it. | |
| Cm | Pitching-moment coefficient about the quarter chord. Negative is nose-down; a cambered section has a negative Cm that barely changes with angle until the stall. |