Compare
You have a shortlist. Which one, at your Reynolds number? Compare puts up to 5 sections on one chart at the same Reynolds numbers and Ncrit, overlays their outlines, and takes a .dat of your own. Library sections cost nothing to overlay: their polars are the stored sweep. A section you drew, uploaded or saved has none until Run NeuralFoil computes it.
Adding sections
Transcript
- Three sections on one chart: the two Mission ranked highest and the NACA 63-412 the freeride template carries, each from its stored polars.
- Pick the stored Reynolds number nearest yours: 5e5 for a cruise at 590k.
- Ncrit applies to every curve at once. The thin SD 8040 has the least drag at cruise; the 63-412 carries the thickness a carbon layup wants. Take the one you choose to its page.
The suffix on a name says where a section came from. A bare name is a library section, selected on Search or sent from a section page, and arrives with the stored sweep. ✦ came from the Kulfan canvas, ↑ from Upload .dat, 💾 from My Foils, your account; these have no polars until you run them.
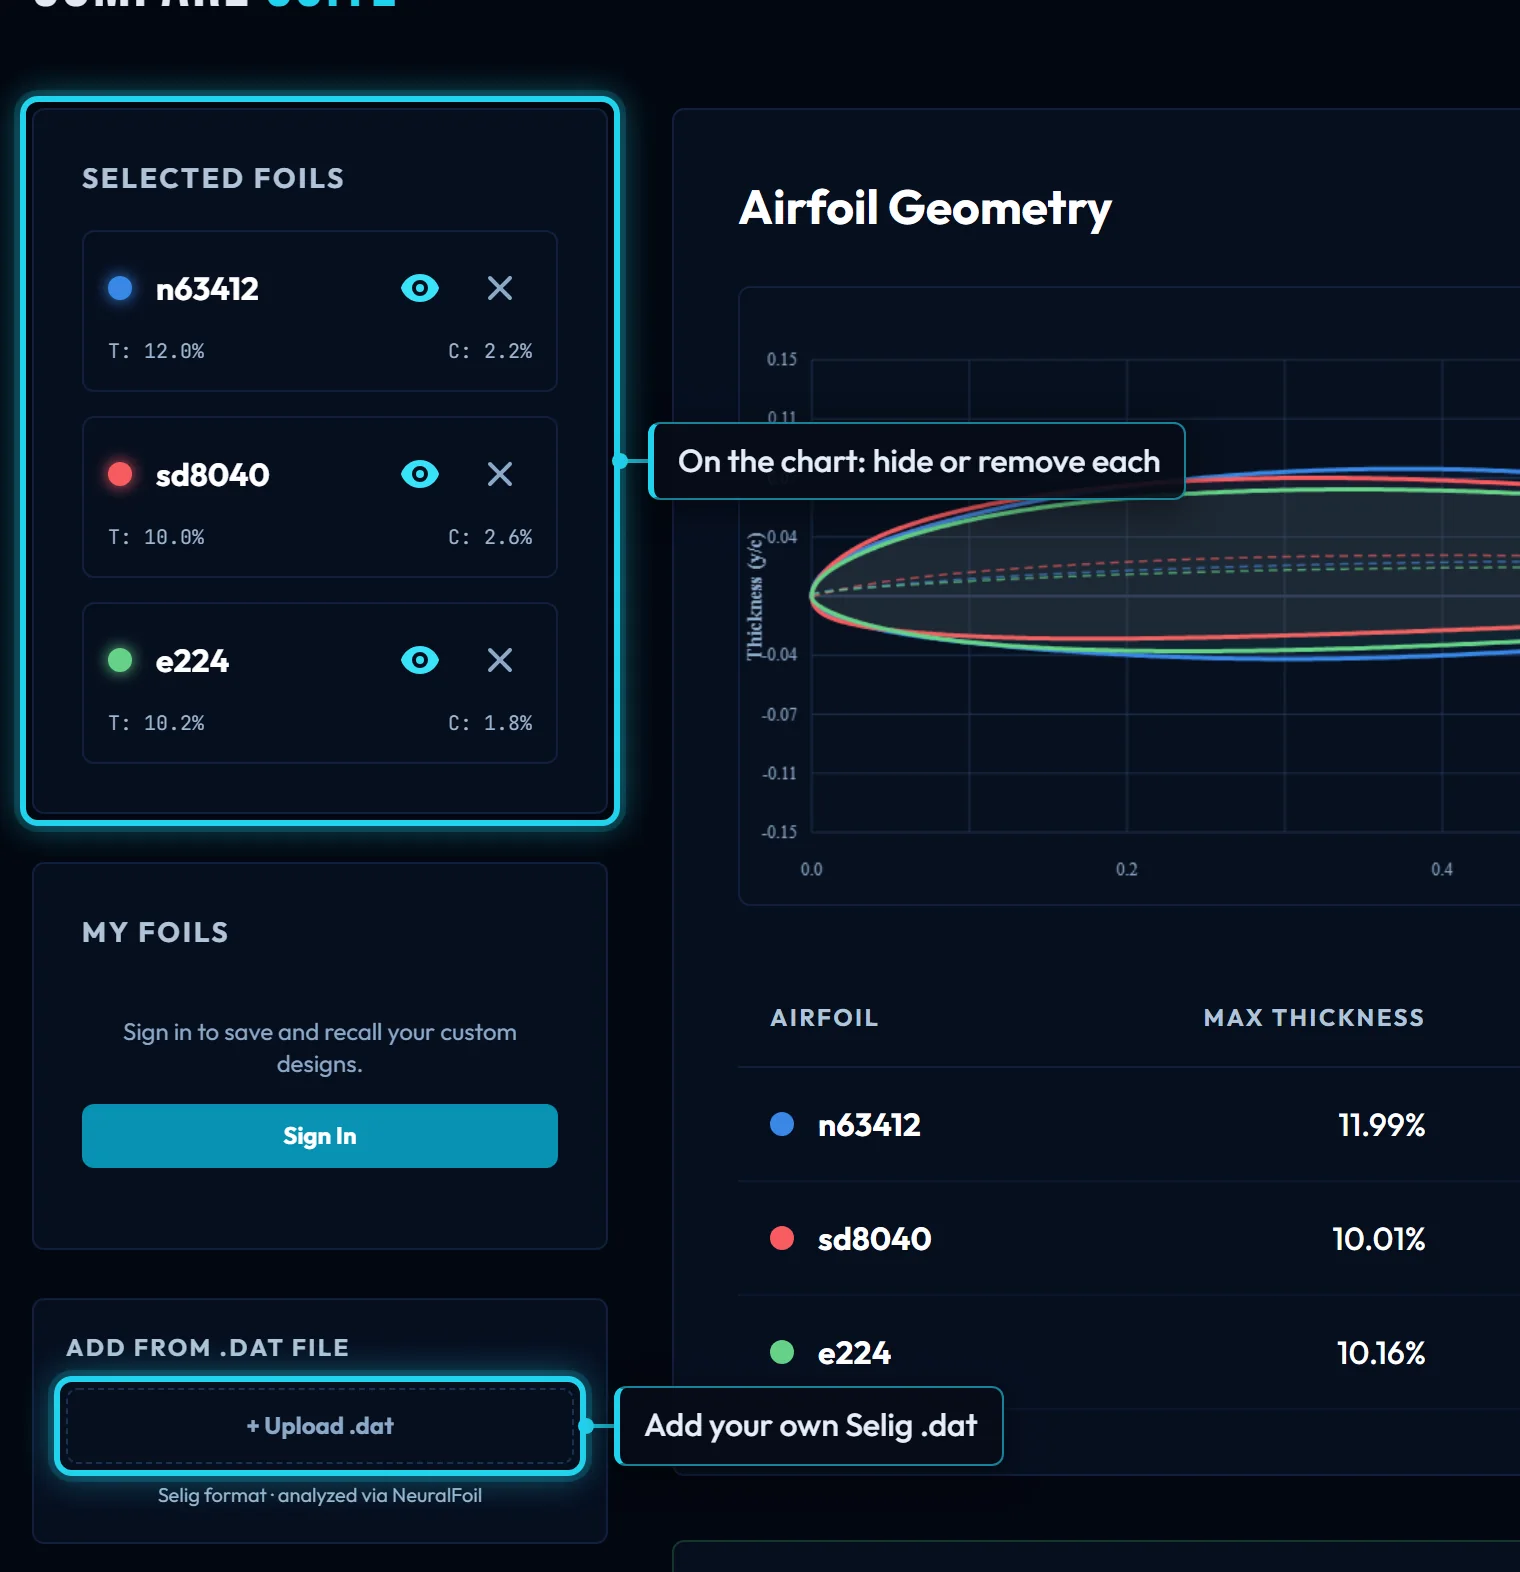
Upload .dat reads a Selig-format file; File formats has the rules and the one format it misreads. Signed in, the cloud button on an uploaded or custom section saves it to your account, where it reappears under My Foils with any polars a run gave it. The eye on a row hides a section from the chart, the preview and the exports; × removes it.
Geometry
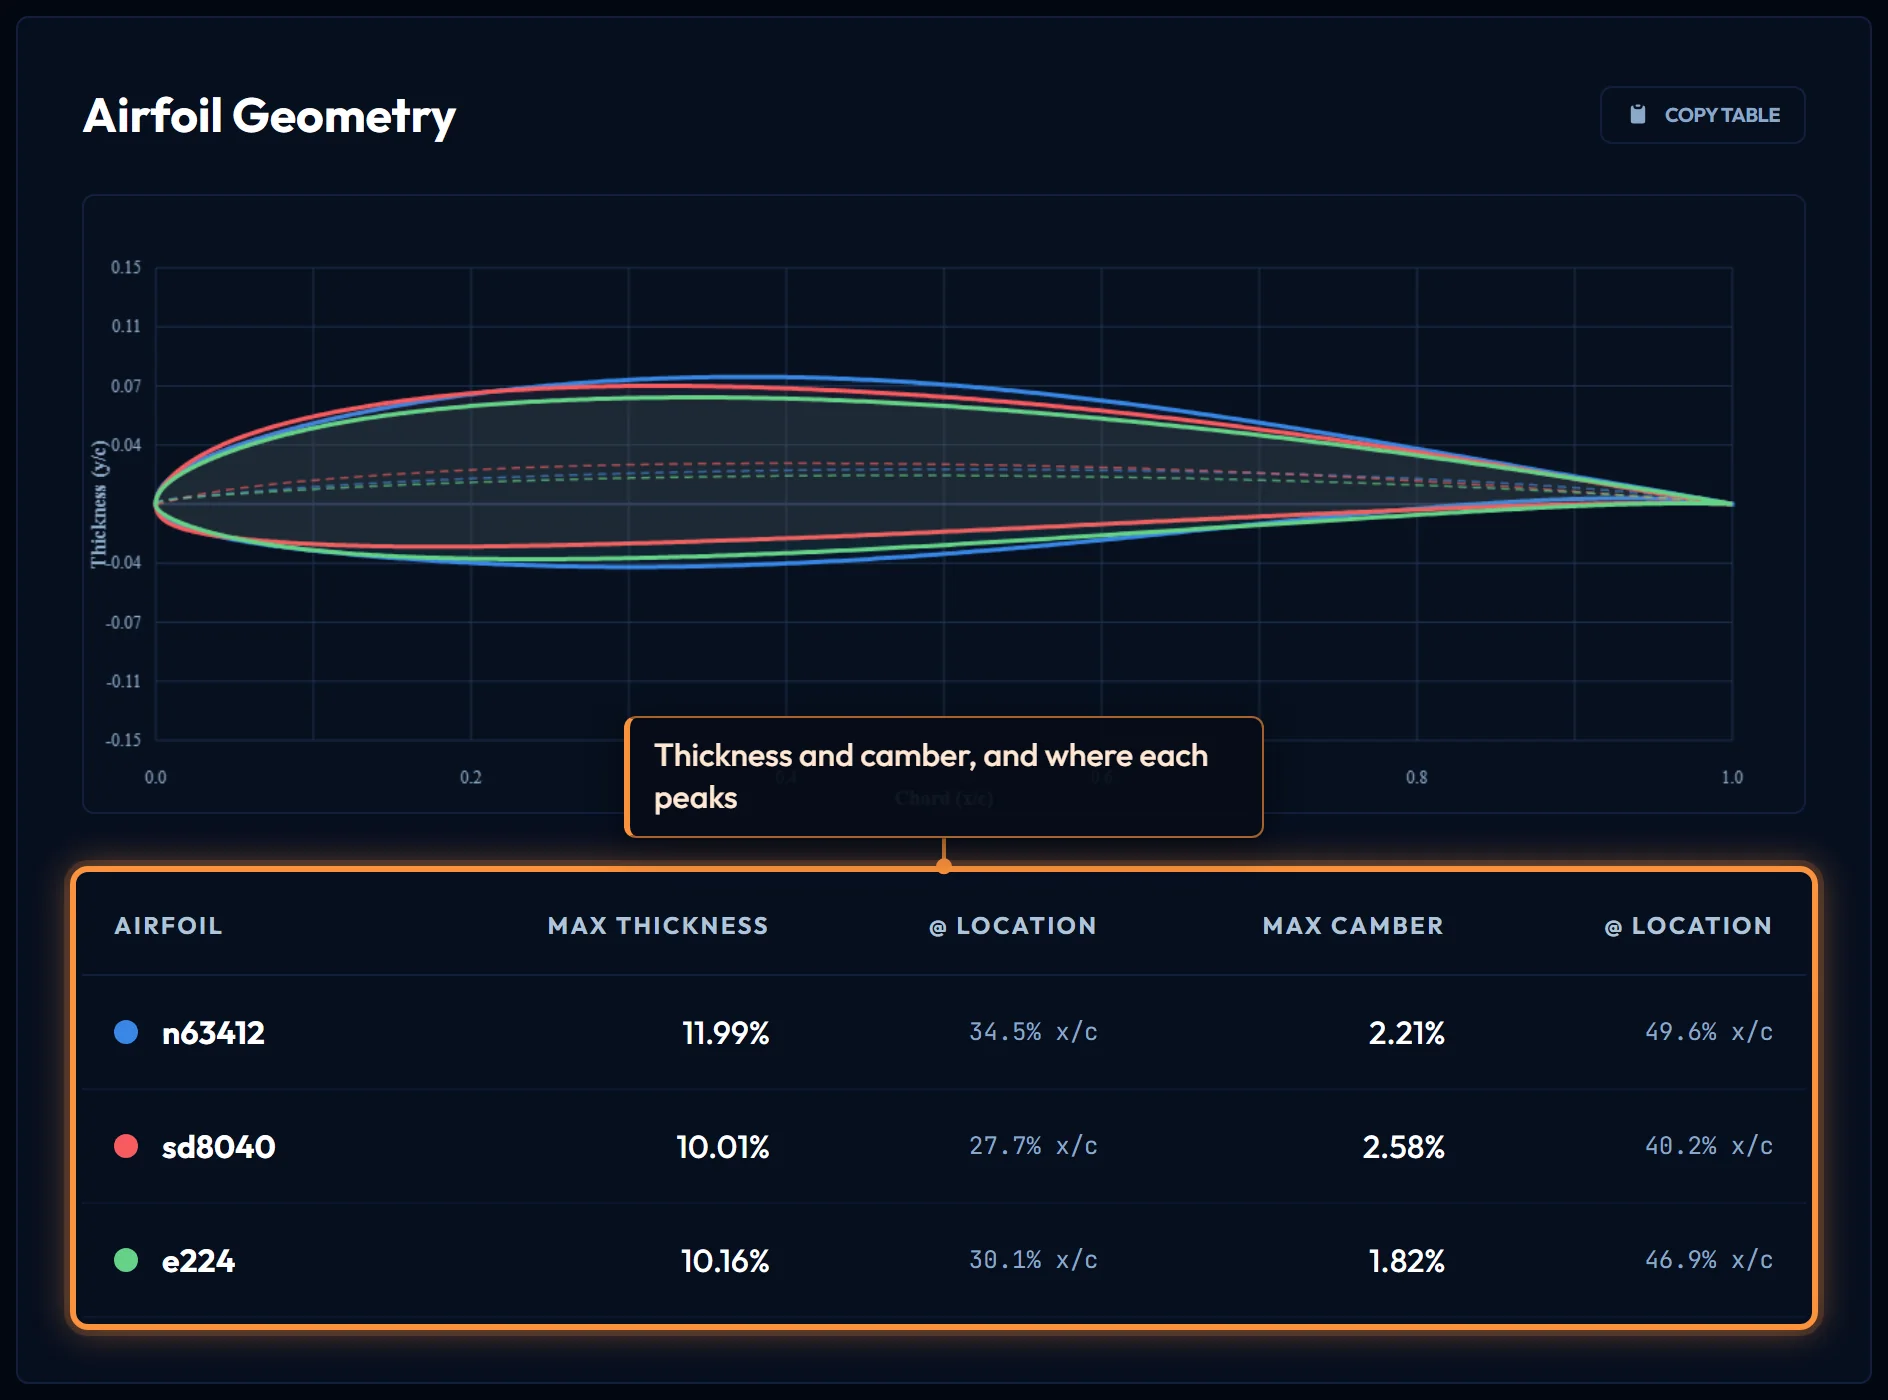
The preview draws every visible section at unit chord, outline and mean line, in its chart colour. T: and C: on each row are maximum thickness and camber in percent of chord; the table under the preview adds where each peaks, from the leading edge. All of it is measured from the drawn geometry. Copy table puts that table on the clipboard as tab-separated text, hidden sections included.
The chart
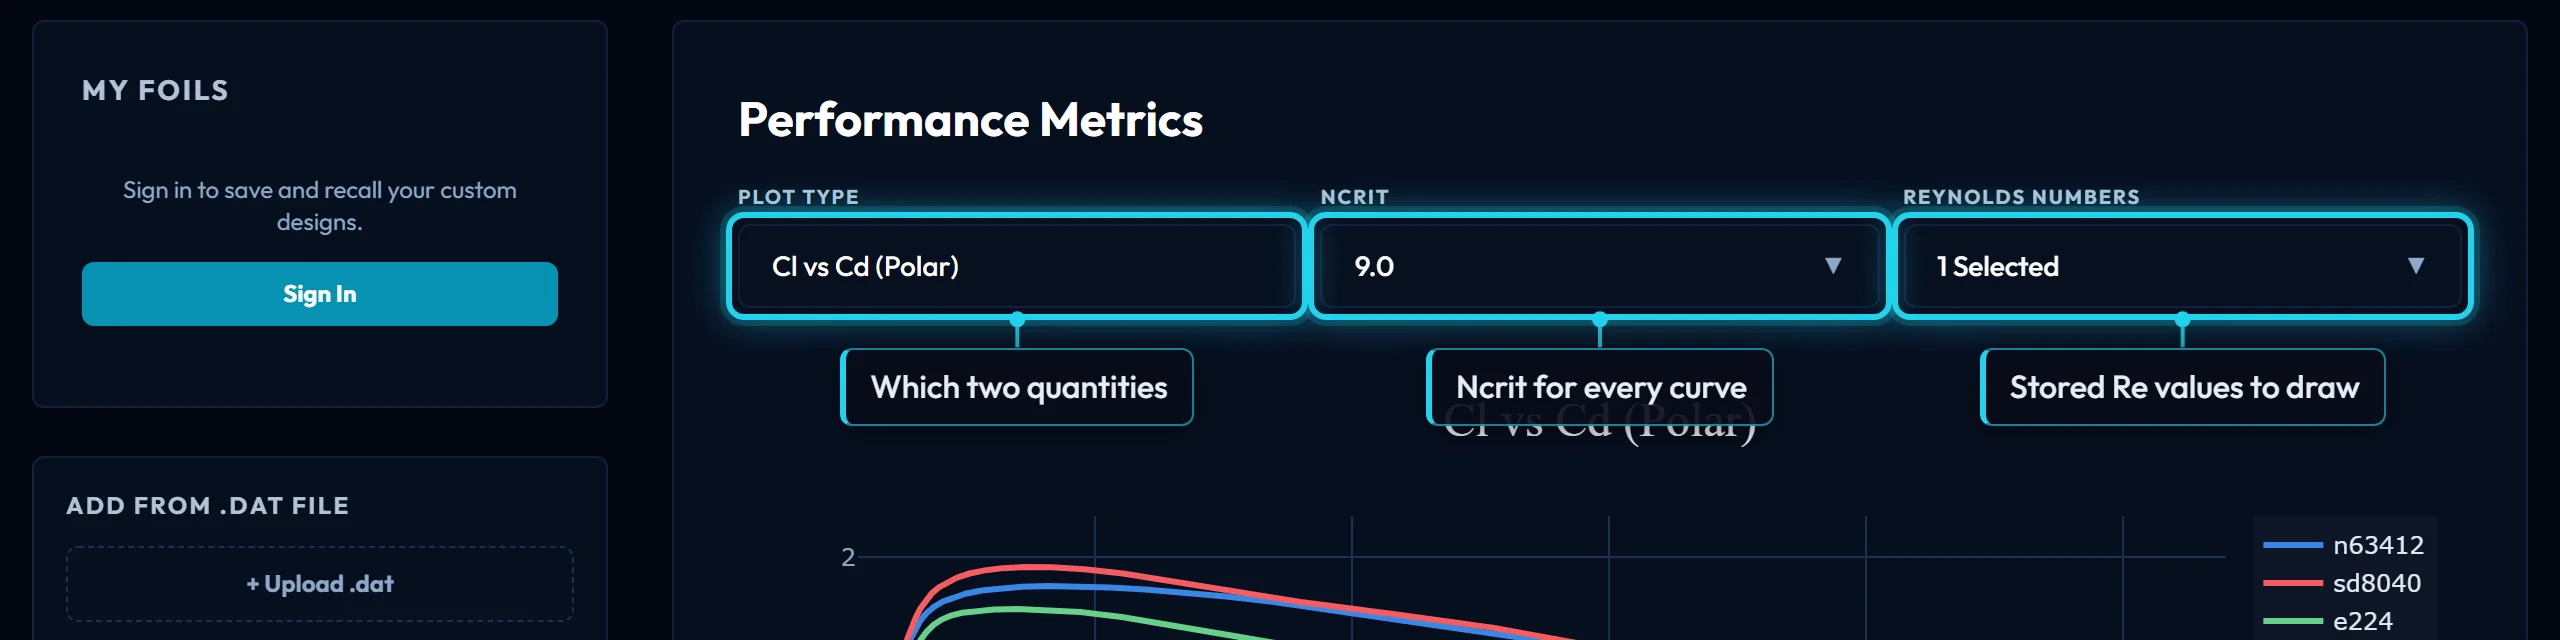
Plot type chooses the pair, as on the foil page. Ncrit picks which stored sweep the library sections are read at, and Reynolds numbers which of their stored values are drawn, one curve per section per value; a run adds its values. The chart opens with the highest Reynolds number ticked. With more than one ticked, the lowest is solid and the rest dashed: a section's curves share a colour, and the line style says the Reynolds number. Hover a curve for its values; click a legend entry to hide it.
The worked case from Getting started: the shortlist is n63412, e818 and sd7003, and the freeride foil cruises near Re 700,000. Tick the stored 500,000 and 1,000,000 to bracket it, switch to the polar, and read drag at a lift coefficient of 0.35, the cruise condition: the curve furthest left there has the least drag at cruise, and the lift view says whether it also reaches the 1.1 that take-off needs.
Running NeuralFoil
The run analyses only the ✦ ↑ 💾 sections among the visible ones; library sections keep their stored polars and are drawn alongside. Reynolds numbers is a comma-separated list, 1e5, 5e5, 1e6, 2e6 to start. Angle of attack runs from Start to Stop every Step degrees, -10° to 15° in 1° steps to start; go past the stall if you want the peak. Mach is 0 to 0.9, 0 being incompressible. Ncrit is the transition setting, which the chart switches to when the run finishes (Ncrit explains the choice). Model is the NeuralFoil network size, large to start.
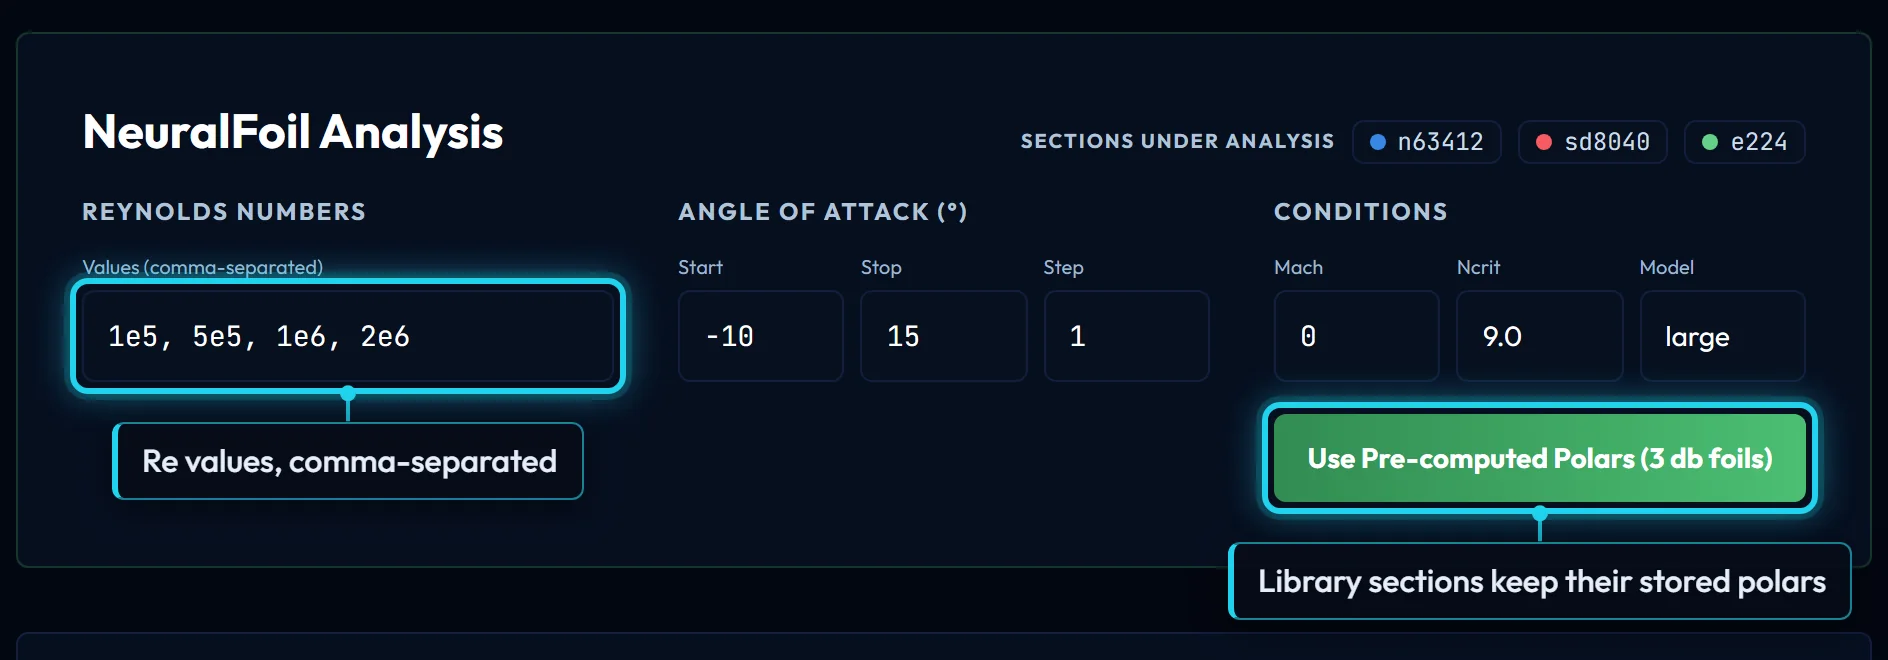
Mach and Model apply to the sections that are run and do nothing to a library section, whose stored polars were computed at Mach 0 with the large network. The count on the Run button omits saved sections, though they are analysed; a saved section's new polars are written back to your account, and a repeat at the same values costs no run.
The run is free: 3 runs per 30 days without an account, unlimited with a free one up to 120 an hour. Each section in a run counts once.
Export and the wing
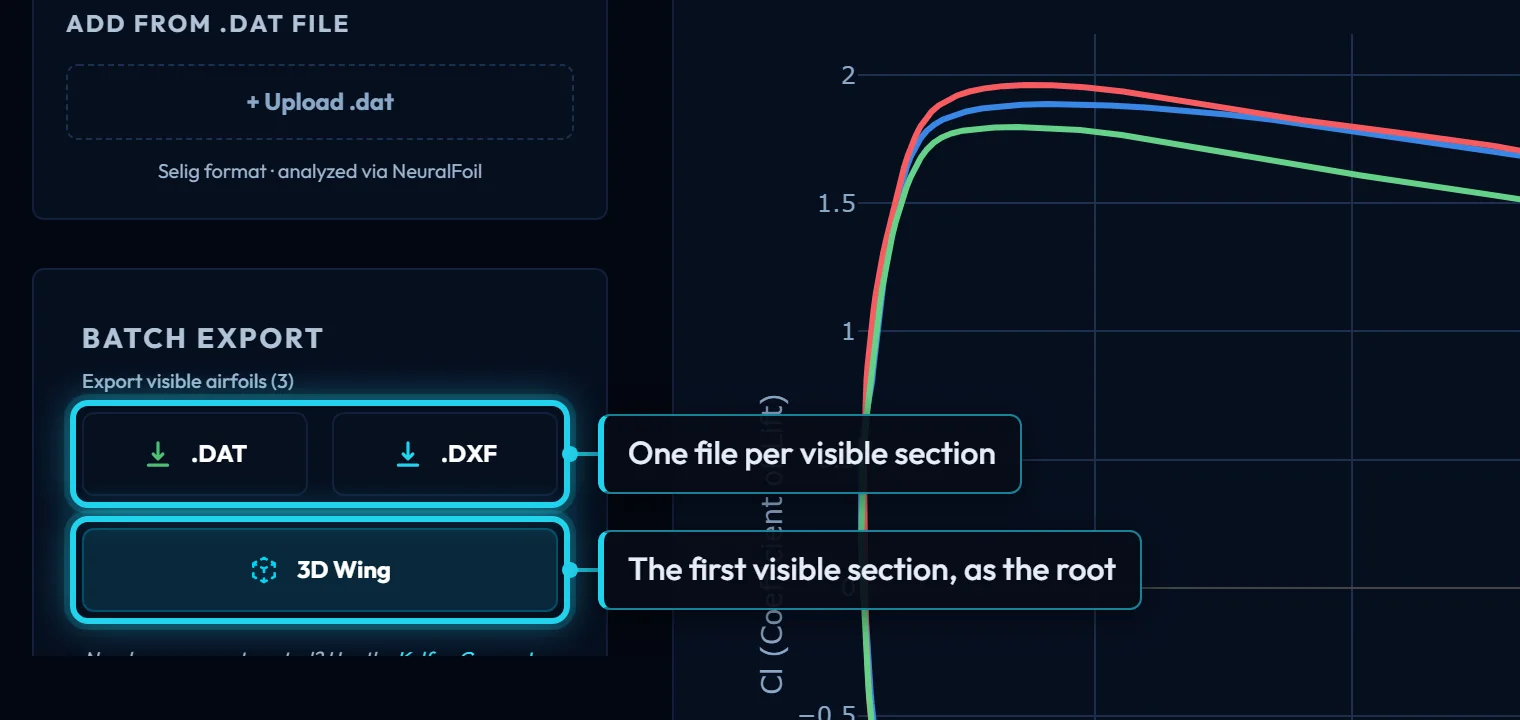
Batch export writes one file per visible section, up to 5: DAT as 151 Selig-order points at unit chord, DXF at a 1000 mm chord. 3D Wing opens the wing designer with the first visible section as the root, and as the tip until you pick another; it needs a library name, so a custom, uploaded or saved section opens the designer with its default section.
What this hands on
One section's name, chosen over the shortlist at your Reynolds number. Its page reads it at the exact value and downloads it; 3D Wing takes it straight to the wing designer as the root section.
Controls on this page
| Control | What it does | Units |
|---|---|---|
| Selected foils | A bare name is a library section with stored polars; ✦ came from the Kulfan canvas, ↑ from an uploaded .dat, 💾 from your account, and those three need Run NeuralFoil. The eye hides one from the chart and the exports; × removes it. | |
| T and C | T: maximum thickness, C: maximum camber, both as a percentage of chord, measured from the drawn geometry. The table under the section preview adds where each peaks. | % chord |
| Airfoil geometry | Every visible section at unit chord, outline and mean line, in the colour its curve has on the chart. The table gives maximum thickness and camber (% chord) and where each peaks (% x/c from the leading edge). | |
| Copy table | Copies the geometry table as tab-separated text (name, max thickness, its location, max camber, its location), ready to paste into a spreadsheet. Hidden sections are included. | |
| My foils | Sections saved to your account from Compare or the Kulfan canvas. Click one to add it (💾) or take it off. Polars from a run are saved with it, so the same Reynolds numbers and Ncrit again cost no run. | |
| Upload .dat | Adds a Selig-format .dat as ↑: two columns x y, chord normalised, split at the midpoint into the two surfaces. It has no stored polars; Run NeuralFoil computes them. Signed in, the cloud button saves it to your account. | |
| Batch export | Every visible section, up to 5, one file each. DAT: 151 Selig-order points at unit chord. DXF: the section at a 1,000 mm chord, for CAD. Hidden sections are left out. | |
| 3D Wing | Opens the wing designer with the first visible section as the root, and as the tip until you pick another. Library sections only: a custom, uploaded or saved one has no library name, so the designer opens with its default section. | |
| Reynolds numbers | Comma-separated Reynolds numbers for the run (1e5, 5e5, 1e6, 2e6 by default; 5e5 or 500000 both work). One polar per value per analysed section. Library sections are not run: their stored values are ticked in the chart instead. | |
| Angle of attack | Angles of attack for the run: from Start to Stop every Step degrees, -10° to 15° in 1° steps by default. Go past the stall if you want the peak; a finer step draws a smoother curve. | deg |
| Mach | Freestream Mach number for the run, 0 to 0.9. 0 is incompressible, right for water and for air below about Mach 0.3. Library sections keep their stored polars, run at Mach 0, whatever is set here. | |
| Model | NeuralFoil network for the run: medium, large, xlarge. Larger is a little more accurate and slower. The stored library polars were run with large and are not re-run, so this changes nothing for them. | |
| Run NeuralFoil | Computes polars for the visible custom, uploaded and saved sections at the options above and draws them with the library sections' stored polars, which are not re-run. The count on the button leaves saved sections out; they are analysed. | |
| Reynolds numbers drawn | Which Reynolds numbers are drawn, one curve each: the stored values of the library sections at the chart's Ncrit, plus any a run added. Opens with the highest ticked; the lowest ticked is solid, the rest dashed. |